Monitoring Journey (1) - What are Prometheus, Loki, Grafana?
Monitoring Journey
This post has been translated from Korean to English by Gemini CLI.
This content is about moving monitoring in a project. If you have any incorrect content or additional commands, please leave a comment or contact me at joyson5582@gmail.com!
Previously, there was a requirement for the 3rd demo day: (log, metric) monitoring dashboard configuration. At that time, we decided to use CloudWatch because we lacked time for feature implementation + we were already dependent on AWS. And, feeling regret about this, we moved.
Previous Regrets
Checking every time in AWS Console
This was surprisingly inconvenient. To enter AWS, I had to go through login + MFA authentication code, and sometimes when I logged out, I had to repeat this inconvenient process.
Poor information provided & difficulty in linking with Slack

We might not have found it, but the data provided by AWS itself was poor.
And, since it was not our own AWS account, there were restrictions when linking with Slack. (No Gateway for Lambda, insufficient IAM permissions)
DB Instance Information
Due to financial issues, we use our own DB installed inside EC2 instead of RDS. In this case, we had to implement it by directly receiving and checking essential information such as QPS, Slow Query, and Locking.
Due to these problems, we decided to use Prometheus + Loki + Grafana.
Prometheus
The explanation of what Prometheus is can be found in the official documentation: https://prometheus.io/docs/introduction/overview/
- Open source belonging to CNCF (Cloud Native Computing Foundations)
- Retrieves time series data through HTTP Request Polling.
- Uses
PromQL. - It is a multi-dimensional data model composed of metrics.
The words are quite difficult.

There’s a little more explanation here.
A metric is a numerical measurement. A time series is a record of values that change over time.
That is,
- Continuously fetch data
- Attach labels to the data (additional information - which instance, when, what attribute)
- Extract and use/visualize it through queries. This is the flow.
Polling
Then, why does Prometheus use the polling method? Generally, anyone who has implemented chat or real-time knows that WebSocket or Server-Sent Events are better. (Or isn’t the Push method better?)
According to the official answer, dev article: Why is Prometheus pull-based?
1
2
3
- Easy to start monitoring. (Because it's HTTP communication)
- Easy to check if the target is dead.
- You can directly check the target status through a web browser.
According to Google Search Labs why prometheus polling? results:
1
2
- Prevents agent overload (if the agent is faulty and pushes too much, it causes overload)
- No agent installation required (no need to install separately)
As such, it focused on ease of use and problem prevention. In conclusion, the official answer also stated that the difference between pull and push methods is not significant from the perspective of the end user or administrator. The method doesn’t seem to matter much ㅇ.ㅇ
Exporter
What is an Exporter, a term that has not appeared above? It is a program that exports as the name suggests.
Installed on the client (WAS, DB)
- Collects various data from the client
- Exposes HTTP endpoints (generally,
/metrics) for Prometheus to collect
There are countless Exporters in the official documentation. From MySql Exporter, MongoDB Exporter, etc., to Kafka Exporter, Jira Exporter, there are truly various types. We will use this Exporter to fetch information from the DB.
Loki
Then, what is Loki? The explanation of Loki is also well described in the official documentation Loki Overview.
- Developed by Grafana Labs
- Designed similarly to Prometheus - Prometheus collects metrics, Loki collects logs
- Indexes labels and metadata to improve performance and reduce maintenance costs
- System & agent push to Loki
The reason why it’s a Push method, unlike Prometheus, is what I think:
- Metrics must always be received. (Unless the server is off)
- Logs must be collected and sent only when they occur.
From this perspective, the two methods seem to be divided.
That is, arbitrary clients send generated logs to the Loki server.
Remember that both are strictly different DataSources.
Grafana
Grafana visually displays the data received from the two DataSources mentioned above.
When fetching,
sum(rate(http_server_requests_seconds_count{application="$application", instance="$instance"}[1m])) - PromQL `{app=”Corea”, level=”DEBUG”} - LogQL
It fetches through queries like this.
That’s right. This is the end! It is designed very simply and clearly.
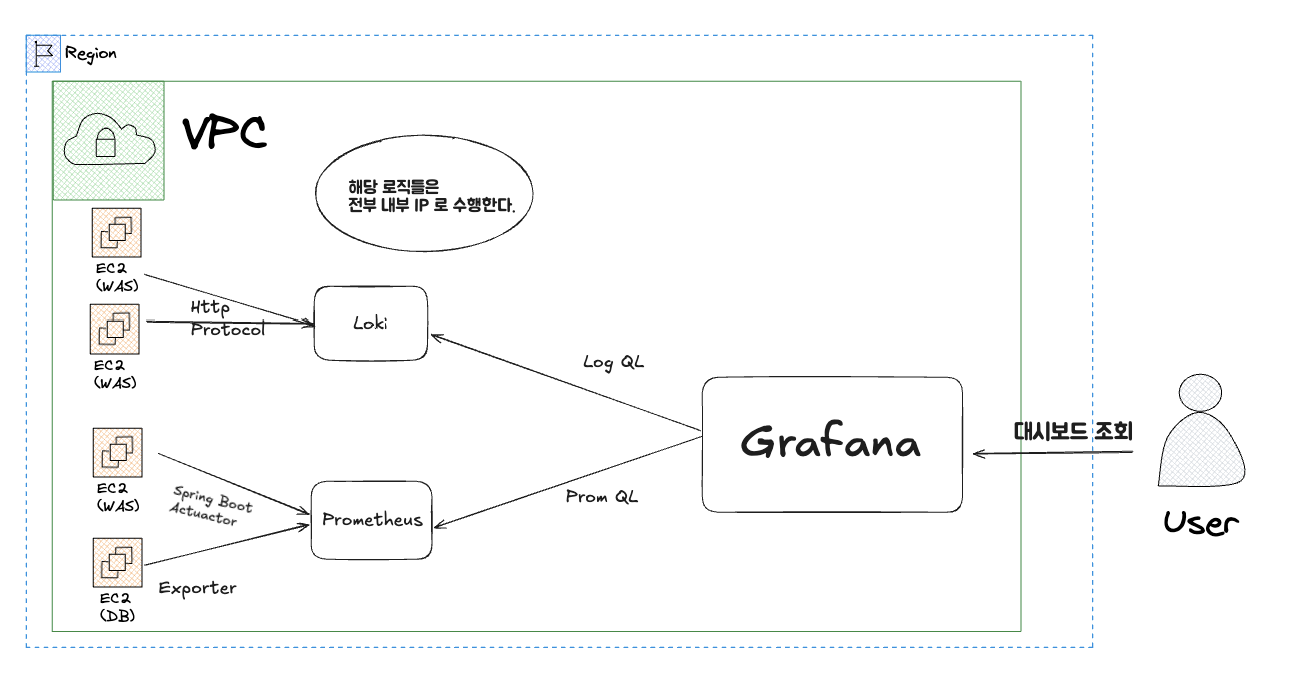
If you draw it,

The infrastructure is configured like this. Then, in the next part, let’s learn how to set up and configure it.
References
[Assignment] Building MySQL monitoring using prometheus and grafana